(this article originally appeared on The Keystone Speculator blog on 12/31/18)
by K E Stone
On the last day, and trading day, of 2018, the Keystone Speculator Inflation-Deflation Indicator is way down to 1.65 signaling that the United States remains mired in deflation. We live in special times. The ongoing deflationary quagmire (America has been in deflation for 8 of the last 10 years) since the financial crisis should correspond to depressed and falling stock market prices but this has not occurred until the crash in equities in Q4 2018.
As 2019 begins, stocks are now falling for three consecutive months; October, November, December. This December is the worst monthly performance for the US stock market since 1931. This year is the poorest stock market performance in a decade.
The power of the Federal Reserve and other global central bankers (ECB, BOJ, BOE, PBOC, etc...) and their Keynesian money-printing is astounding. The central banker printing presses have created a one-decade long stock market rally (March 2009 to present), the second longest in history, rewarding the wealthy that own large stock portfolios. Common folks, however, have not benefited from the central banker largess. The middle class, now a lower middle class, and the disadvantaged and poor are p*ssed on by trickle-down economics. One-half of Americans do not own one single share of stock.
There is an ongoing battle between goods inflation/deflation and services inflation/deflation. Generally, the goods and services should track in relatively the same direction but something special has been occurring the last few years. The central bankers have destroyed all price discovery in markets due to their Keynesian intervention. Global markets are twisted into knots; no one truly knows the correct price for anything anymore.
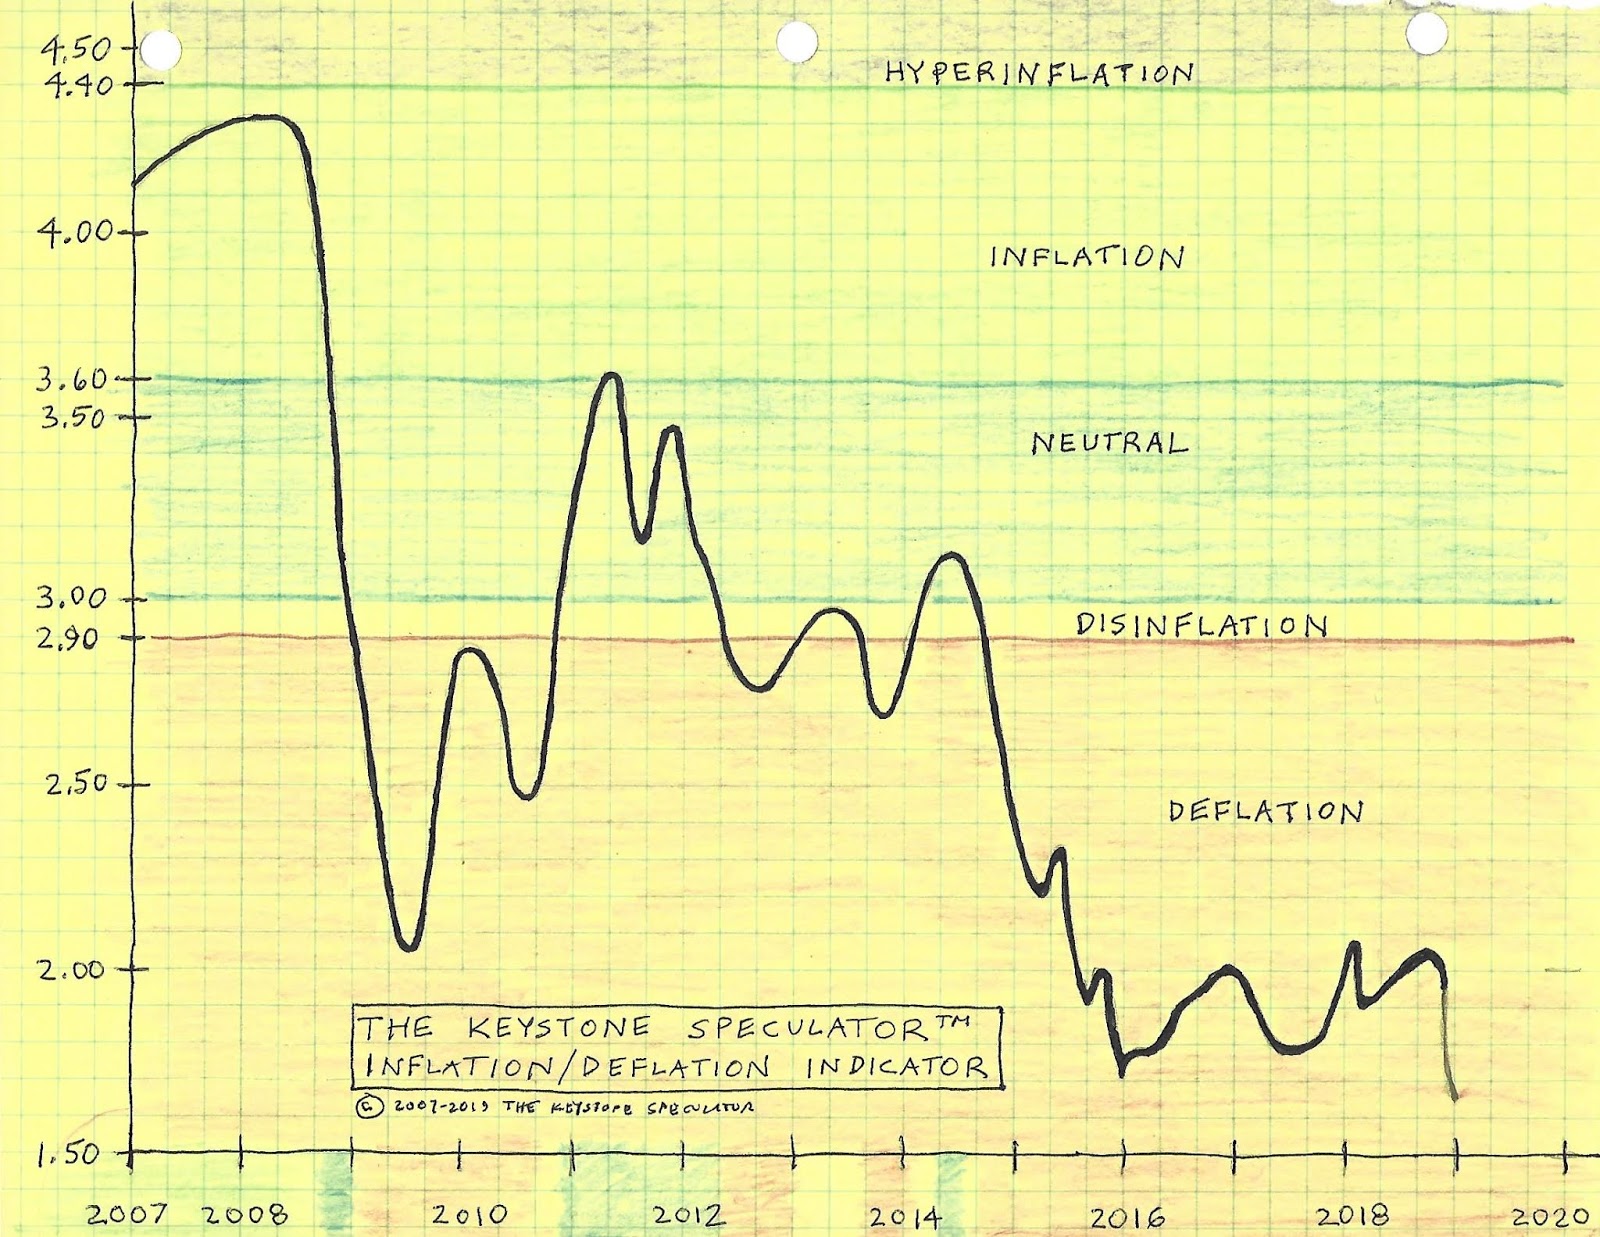
The chart above is weighted for the goods-oriented inflation/deflation since the CRB commodities index is used in the numerator of the ratio. The internet, technology and computers are huge deflationary machines eliminating jobs and continuing to lower prices. Electronics and products such as smartphones turn into commodities and are cheaper each passing year. Corn and wheat crops are at bumper yields. The world is awash in oil maintaining a lid on fuel prices.
On the services side, however, prices are flat after maintaining buoyancy the last couple years. Recently, services prices may be showing signs of rolling over. Those of you paying college tuition bills see prices rise each year. Heath insurance (ACA; Obamacare) and medical costs are out of control. Prescription drugs are expensive; many Americans over 50 years old take a palm-full of pills each day. Utility bills consistently sneak higher. Haircuts cost more each year. Home prices continue rising creating the inflationary vibe. These services prices that create that slight inflationary vibe are likely moderating going forward.
Another reason that market participants may think they see inflation is that the well-paid talking heads on television tout the higher services costs all the time. The reason the pundits tout inflation is because they are the ones living in the expensive homes, taking the prescriptions drugs daily, paying the high costs of insurances and saving money to pay high tuition costs for their children. Most market participants are making money and doing well in their careers so they are predisposed to believe inflation is occurring because of the costs they see in their higher-class daily lives. However, they must realize they are fortunate enjoying a higher standard of living than most other common folks across the United States.
The lower middle class, disadvantaged and poor folks instead see deflation. Generalizing, common folks of modest means live in run-down houses or apartments, many do not have health or other insurances and they have no hope in seeing their children go to college. They do not see the services inflation that the upper middle class and wealthy tout.
The services components in inflation create the vibe that inflation exists in the economy when in reality it does not. The expectation is that the US and the world will enter a recession at some point forward and the slight services inflation would be expected to roll over to the downside to join the goods deflation sitting in the basement. When the recession hits, people lose jobs, they do not spend money, prices drop. Customers begin delaying services that they routinely used before the recession. Once you lose your job, your whole life will change. Subscription services will be cancelled as people lose jobs in the coming recession.
Inflation proponents need the chart above to start ramping higher to prove their thesis correct, however, that appears a tough row to hoe. It is less likely that goods inflation will all of a sudden begin moving strongly higher to join services rather than services dropping lower to join goods, especially with a recession on the come.
The US may remain mired in deflation for a couple more years but sure as night follows day and day night, inflation will arrive again. The last time that a notable whiff of inflation existed was back in early 2011 now six years in the rear view mirror. You will know inflation when it arrives since every day all day long, coworkers, family members and strangers will complain to each other about prices of everything including milk, gasoline, food, services, utility bills, etc....; this is not happening right now.
After the chart moves higher in the months and years ahead, the velocity of money will kick in and the money sitting idle at banks will be put to work. A multiplier effect will accelerate business activity and inflation will leap higher and then the country will likely shoot up into hyperinflation say in the 2020-2025 time frame. That will be a different problem and a future troubled bridge to cross. For now, deflation remains in charge.
Keystone’s Inflation-Deflation Indicator chart shows the markets and economy remaining mired in deflation. The majority consensus on Wall Street continue to tout inflationary forces ahead. After all, the Fed did hike rates in 2018. Money managers cheer inflation since they all are heavily invested in the banks hoping for higher rates and a steeper yield curve. The Federal Reserve has called the current lack of inflation "transitory" although humorously, the so-called transitory disinflation/deflation is now running strong for months and years. Bernanke and Yellen each said deflation is transitory (comically, however, they would never say how long 'transitory' is).
Inflation is Godot. Inflation has been pictured on a milk carton for the last few years (missing). Deflation rules the roost. The chart shows that more up in yields, and higher commodity prices, are needed for the indicator to move higher towards inflation and neither are cooperating.
Keystone's Inflation-Deflation Indicator remains in DEFLATION at 1.65 the lowest since both the 2015 low and the low during the 2008-2009 financial crisis. The Keystone Speculator Inflation-Deflation Indicator remains mired in the deflation region and the low number is actually extremely problematic and worrisome.
The 10-year Treasury note price is used for the denominator (bottom number) of The Keystone Speculator Inflation-Deflation Indicator. The 10-year Treasury price is 103.50 (103 16/32) with a yield at 2.72%. Commodities are in the numerator (top number). The CRB Commodity Index is 170.97. Calculating Keystone's ratio;
The Keystone Speculator Inflation Deflation Indicator
CRB/10-Year Price = 170.97/103.50 = 1.65
Over 4.40 = Hyperinflation
Between 3.60 and 4.40 = Inflation
Between 3.00 and 3.60 = Neutral; Inflationists and Deflationists Battle
Between 2.9 and 3.00 = Disinflation
Under 2.90 = Deflation
Despite all the hoopla and trumpets blaring that inflation has arrived, the economy and markets instead remain mired deep in deflation. As the above discussion highlights, commodities and goods are in serious deflation while the services components may now be rolling over into deflation. When the recession hits, housing prices will fall. Services (fees and costs charged to the consumer) will likely trend lower with deflationary behavior to attract a decreasing number of interested users and buyers.
The main reason for the lack of inflation and ongoing persistent deflation is the lack of wage growth. Inflation cannot exist without wage inflation (watch the Friday Monthly Jobs Report to see if any wage inflation occurs) and wage inflation is not occurring. Wage inflation is growing annually at about +3% a paltry amount. When is the last time you had a substantive raise?
The Federal Reserve needs to see the annual wage growth at +4.0% to +4.5% to be comfortable knowing that inflation has taken hold and will be sustainable going forward but this is a dirty little secret they will not discuss in public. Powell performed cartwheels of joy in the hallway of the Eccles Building when wages cracked the +3% annual level but in his heart of hearts he knows wages must inflate far higher to sustain ongoing overall inflation. If the 3%-handle reverts back to a 2%-handle, Powell will be crying in his cafe latte.
The United States remains in a deflationary funk since August 2014 a solid 4-1/2 years. Think back to the summer of 2008 if you want to relive the feeling of rising inflation. Rising prices were a common daily complaint at office water coolers, supermarkets and dentist offices back in 2008; not now. When inflation occurs, you will feel it and you will hear about it from family, friends and coworkers. You will be complaining about the huge cost increases for everything. This vibe is not occurring. There is no inflation currently; only deflation. Inflation is Godot.
There is a whiff of services inflation occurring as mentioned at the top of this article. The bulk of this is due to rising medical insurance (Affordable Care Act; ACA; Obamacare) and prescription costs, increasing college tuition and rising accounting, attorney and professional service fees. Home prices have also been inflationary but have been peaking and topping off lately perhaps ready to subside. Lower house prices would dampen inflation expectations and serve to keep the chart in the disinflation and deflation camp.
The world is awash in oil but the OPEC and non-OPEC nations succeeded in colluding to limit production to artificially drive prices higher in 2017 into early 2018. That was fine for a while but in late 2018 oil prices crash -40%. The move up in oil provided a tiny whiff of inflation forces in late 2017 and early 2018, but the drastic -40% crash in oil from September 2018 to present pushes Keystone's ratio down to 1.65 proving that America is mired in deflation; perhaps only a hair from a tragic deflationary spiral that sunk the United States after the 1929 crash and during the 1930's Great Depression.
All that oil sloshing around is oversupply and deflationary. Commodities remain very subdued in price. A large increase in commodity buying and shipping is needed to prove that inflation is on the rise and that is not occurring. The BDI (Baltic Dry Index) remains subdued.
The retail bankruptcies and store closures increase. The US is grossly overstored by a factor of 3 to 1 compared to other Western nations. The retail carnage is disinflationary since racks of clothes and other products will be sold pennies on the dollar to liquidate inventories. A recession would exacerbate this activity. Sears and Kmart stores are closing; inventories are being liquidated.
There is no demand in this sick stagnant economy that is only pumped-up by fits and starts of central banker monetary policy and/or government fiscal stimulus. Deflation is identified by consumer behavior that wants to wait for the future to buy something since they believe the item will be cheaper. Of course companies cannot maintain staff waiting for your cheap butt to buy something, so they have to lay off more workers which further exacerbates the recession and deflationary scenario. Prices drop lower and customers are only encouraged to keep waiting before buying anything since they now expect prices to drop even lower. This, folks, is a tragic deflationary spiral. It be very, very bad. Great Depression bad.
A recession is long overdue. A recession will usher in deflationary behavior and is likely coming far faster than anyone realizes. Treasury yields will fall as investors seek safety in notes and bonds (price up yields down). This will surprise the consensus on wall Street that is guaranteeing higher Treasury yields going forward. Keystone’s indicator will then drop as the price in the denominator moves higher although the indicator probably does not have much further to drop. Likewise, demand for commodities decreases in a recession so the CRB index drops and a lower numerator in the indicator will send the ratio number lower as well; a 170-handle on the CRB is an extremely low and deflationary number already.
The structural unemployment problem remains in the U.S. and the current stagnant wage growth (wage deflation) reinforces an ongoing deflationary and disinflationary theme. Technology, computers and the Internet are huge deflationary machines. Robots continue to replace human's on the job.
The GOOGL, TSLA and other major automaker's driverless vehicle technology already has trucks operating on the road in California and other states and auto manufacturers are pouring billions into this technology that will eliminate more jobs over time. Driverless vehicles will greatly impact the trucking industry. Trucks could transport goods without the need for drivers allowing companies to drop-kick more workers across the parking lot (in actuality, there is a truck driver shortage so companies will simply be relieved that can meet their shipping demands using driverless trucks). The pattern of 'more tech--less human's' will continue. Fast-food restaurants, such as Mickey D's, are introducing kiosks that eliminate more jobs. Automation and technology is deflation.
The structural unemployment problem will continue in the US for years and perhaps decades forward. The unemployed and underemployed create a burden on the economy over time. The wealthy on Wall Street, in bed with the Fed, make themselves filthy rich by taking advantage of the 2008-2009 crash (easy money pumps the stock market higher) while the middle class and poor (that do not own stocks) are thrown under the bus over the last decade. The Fed members perform the bidding of the investment banks since they are rewarded with lucrative speaking gigs after they leave public office; a quid pro quo for their loyalty in maintaining easy-money conditions that send stock prices higher and benefit the elite class.
It is disgusting watching the privileged wealthy class take advantage of the rigged crony capitalism system raping America for all its worth starting with sending middle class jobs overseas in the 1970's and 1980's. The greedy politicians and corporate executives kept eliminating middle class jobs in favor of slave labor overseas. The lower expenses drive up stock prices making all of them filthy rich over the last few decades. The wealthy class, about 20 million strong, spit on the other 300 million Americans over the last five decades. The best part is that the elite class makes millions off the rigged system they control then they turn around and complain to America that they pay the bulk of the taxes. You have to love the pseudo free market crony capitalism system. Capitalism does not exist because transparency does not exist.
Companies are meeting EPS (earnings-per-share) by laying off workers and squeezing more production out of existing workers (as evidenced by flat to lower top line revenues for companies across all sectors for the last couple years). Instead of creating jobs and buying equipment with the central banker easy money, companies use the dough for stock repurchase programs (buybacks) that artificially pump stock prices higher. Yes, they are greedy b*stards only concerned about increasing their own wealth.
Watch Keystone's formula above; you can crunch the numbers to check the indicator every few weeks. It was shocking to see equity markets print new record highs against a disinflationary and deflationary back drop but now markets are starting to make more sense. The current market behavior is unprecedented; perhaps a 1930's redux.
The amazing power of the central banker money-printing is God-like. The central bankers are the market. They are modern day money Gods in charge of the Temple. Kneel before their Power and Majesty. The Fed may back off on further rate hikes (dovish) and the PBOC (China's central bank) keeps stepping up its plans to provide stimulus in Q1 to goose China's economy and markets (which will also boost the global markets). The central bankers are the market. The are sick, one-trick ponies. They will print money until the whole system collapses.
The Brexit stock market crash in late June 2016 was stopped by the BOE promising easy money. The PBOC keeps pumping China’s economy and markets. The Fed has remained accommodative with low rates despite the tiny rate hike path over the last couple years. The BOJ keeps implementing stimulus programs. The ECB is supposed to end its QE program today and perhaps raise rates starting summer 2019. Pause for laughter.
The central bankers create the all-time record highs in the global stock markets. The world is awash in central banker liquidity and all that money sloshing around has to go somewhere so it pumps-up all asset classes. The wealthy dance with glee as stock, bond, art, vineyard, real estate, collectibles and classic car prices leap higher on easy money. The wealthy light expensive cigars and dab the ashes onto the faces of the once-middle-class. America is in a new Gilded Age a la the 1920's. The divide between rich and poor is the widest in 50 years. A nasty, and likely violent, class war is likely on tap for America in the months and year or two ahead likely triggered by the recession.
Inflation is not in sight currently. The inflation-deflation indicator moving a touch above 3.00 in early 2014 was due to rising food and beef costs. Corn and wheat prices have plummeted back to earth. Crops are producing yields at record highs so prices remain subdued. The cheaper grain prices will bring down the cost of beef especially as herds increase after the culling due to drought four years ago.
Stagnant wages in America will prevent inflation from occurring. When wages rise, that will tell you inflation is coming fast and Treasury yields will then rise strongly. As long as wages remain flat or lower, inflation will not exist. Focus on the wage data in the monthly jobs reports.
Think back to the last period of rampant sustainable inflation in 2006-2008; you were likely enjoying happy raises at work each year, right? And probably not so much from 2009 to present? Correct? In fact, it feels like you are working for the same amount of money for the last 10 years.
All this windbag mumbo-jumbo aside, what does the above say in a nutshell? The current answer to the ongoing inflation-deflation debate is DEFLATION as much as everyone tries to ignore it and say that inflation is here to stay. After a decade of obscene Fed and other central banker money-printing, the United States economy remains mired in deflation proving that Bernanke's grand Keynesian experiment, blessed and implemented by Fed Chair Greenspan, and then pursued by former Fed Chair Yellen, and now further implemented by Chairman Powell, as well as dovish Fed members such as Evans, may be tragically failing.
It is prudent to prepare yourself and your family by raising as much personal cash as possible and paying off debt. Avoid taking on new debt. Cash is king in deflation. Show respect to holding cash.
Many analysts argue against the overall ongoing global deflation hypothesis saying the view on services inflation versus goods inflation must be explored in more detail. Granted, services are experiencing some inflationary effects while goods are in a strong deflationary trend. The very minor whiff of services inflation will likely roll over lower as the US slips into recession in the months ahead.
All of you inflation enthusiasts do not fear, however, inflation will arrive soon perhaps in the 2020 time frame and then hyperinflation in 2021 and beyond. That will be a whole new set of problems, that is if we survive this ongoing bout with deflation. Pray that it does not develop into a deflationary spiral a la the Great Depression.If we manage to avoid the deflationary spiral, in a couple years rampant inflation will develop as the velocity of money ramps higher. This will then lead to out-of-control inflation, hyperinflation, in the 2020's decade. There is nothing but minefields ahead of us.
In a nutshell, the United States remains currently mired in DEFLATION as it has been 8 of the last 10 years since the 2008-2009 financial crisis. Inflation is Godot.